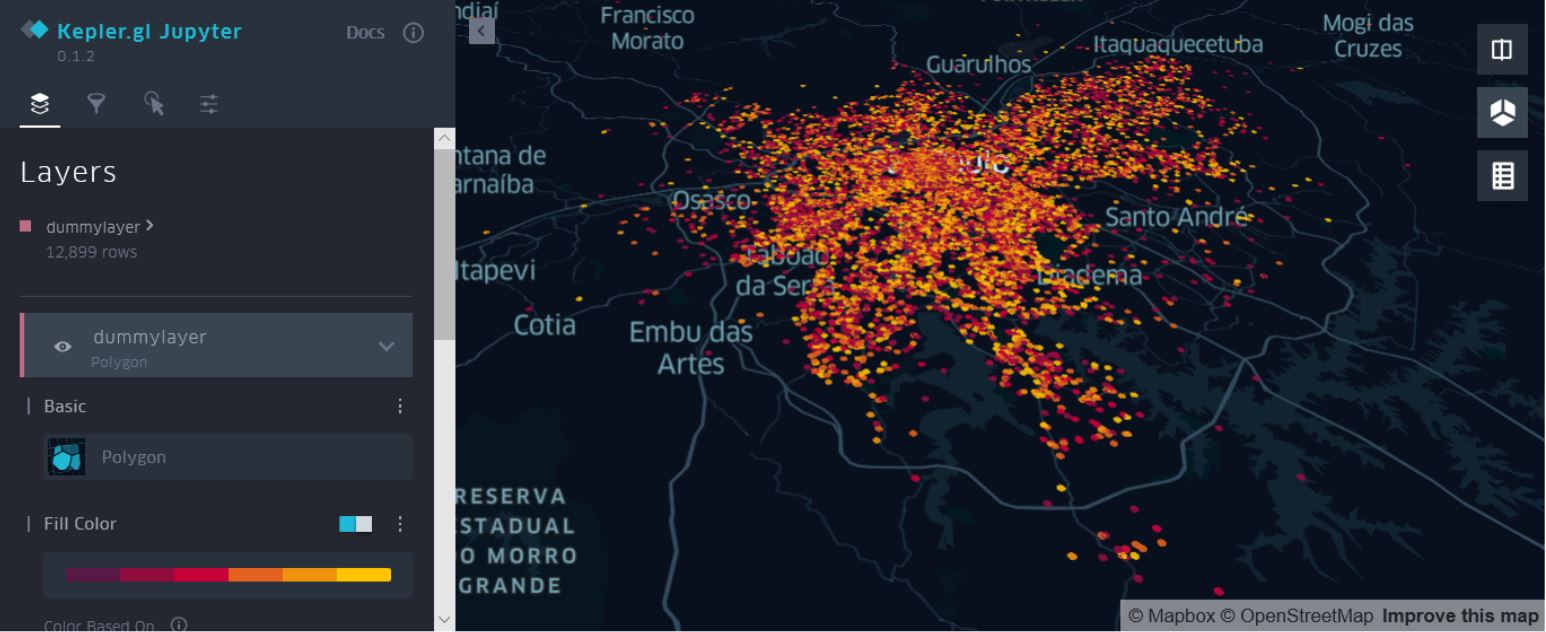
Geo Spatial Visualisation Kepler.gl
3 lines of Python code
If you spend a lot of time analyzing geospatial data in Python do give Kepler.Gl a try. The flexibility of analyzing geospatial data in under three lines of python code is impressive
find this very useful for quick wins https://kepler.gl/
import pandas as pd
import keplergl
import geopandas as gpd

read csv data , other formats supported
data = pd.read_csv("")

convert data into geodataframe
gdf = gpd.GeoDataFrame(data,geometry = gpd.points_from_xy(data.lng,data.lat))

create a base map with kepler
map = keplergl.KeplerGl(height=400,width=800)

add geometry encoded dataframe to map
map.add_data(data = gdf, name = 'dummylayer'

